Data-Driven Decision Making – from Scheduled Reports to CAFM Dashboards and Custom Analytics
The remit of facilities managers continues to expand. From improving equipment performance and asset lifespan through effective preventative maintenance to ensuring regulatory compliance, assessing options for meeting sustainability goals and, increasingly, juggling the new workspace challenges created by hybrid working – every day presents a new set of challenges. This is simply not a role that can be efficiently achieved using paper-based data and spreadsheets.
Facilities managers need fast access to accurate, up-to-date information. They require automated dashboards that provide an ’at a glance’ status view of the asset and equipment estate. Plus, of course, with the need to better understand how changes could improve waste management or reduce energy consumption, they need the ability to interrogate the data.
Reporting tools, including customisable dashboards and automated reporting, are a core component of CAFM Explorer. How do these features help organisations gain insight into their operations and make data-driven decisions?
Standard Reports
With 260 standard reports, CAFM Explorer can provide an enormous quantity of information straight out of the box. Reports can be scheduled at any time to automatically drop into a user’s inbox – or pulled up on demand as required. And every end user can set their own parameters to reflect their specific area of interest.
Typically, the most used reports relate to work orders – both scheduled and reactive. What equipment has required work? Has the job been completed? How long did it take – and was it achieved within the Service Level Agreement (SLA)? How much did it cost?
Reports can also provide insight into the performance of subcontractors, enabling both effective management and useful comparative analysis before contract negotiation.
With 260 standard reports, CAFM Explorer can provide an enormous quantity of information straight out of the box. Reports can be scheduled at any time to automatically drop into a user’s inbox – or pulled up on demand as required.
Furthermore, because CAFM Explorer is both multi-currency and multi-time zone, it can be used internationally, creating a single source of reports for an organisation’s entire global operation.
Customisable CAFM Dashboards
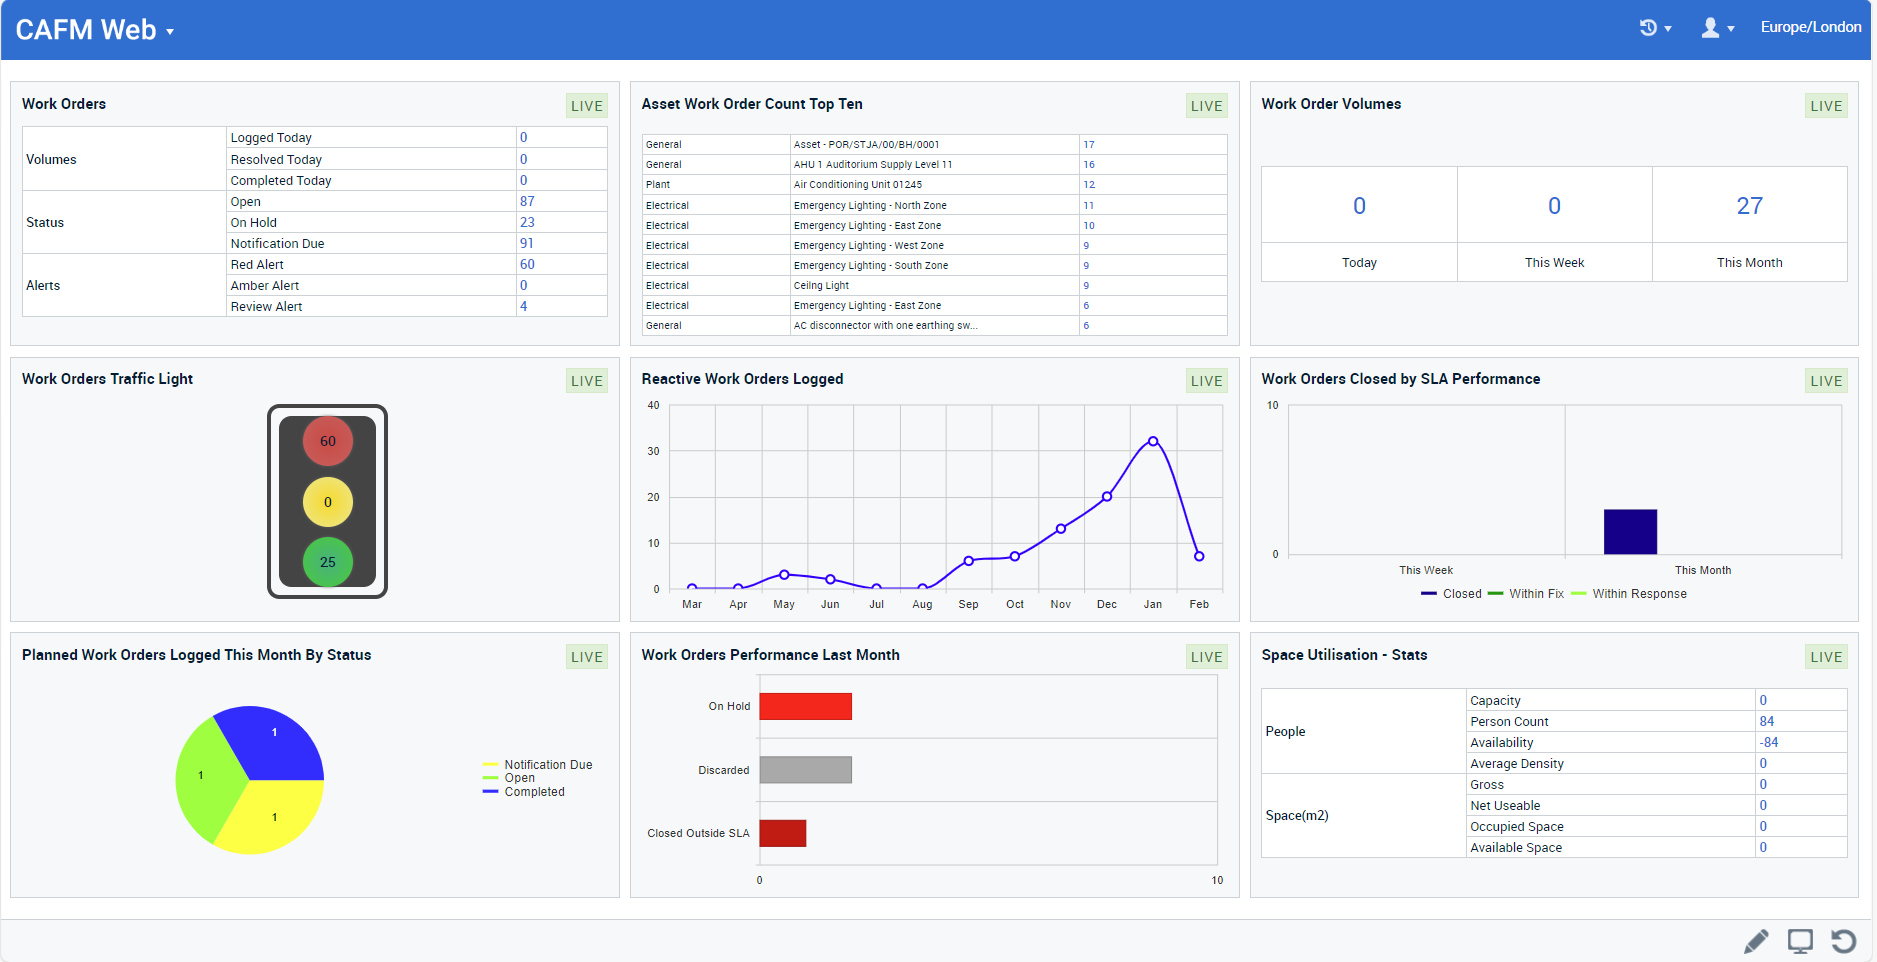
CAFM Explorer’s dashboard has nine widgets that can be used to customise the dashboard parameters to reflect each individual’s needs, as well as track their Key Performance Indicators (KPIs).
- An engineering team leader, for example, might want to see which work orders are outstanding, the servicing required and the jobs allocated to each engineer.
- A facilities manager might be looking at which equipment has had the most call-outs this month or has been the most expensive to support replacement plans.
- A help desk manager will track outstanding user support calls, engineer response and speed to resolution.

CAFM Explorer’s dashboard automatically updates in response to engineers inputting their work orders in real-time in the field, providing the facilities manager with real-time information on everything from the status of equipment servicing to the adherence to SLAs. It can also include KPIs for service providers and subcontractors, ensuring the facilities manager has a complete view of the quality and timeliness of service delivery at all times.


